
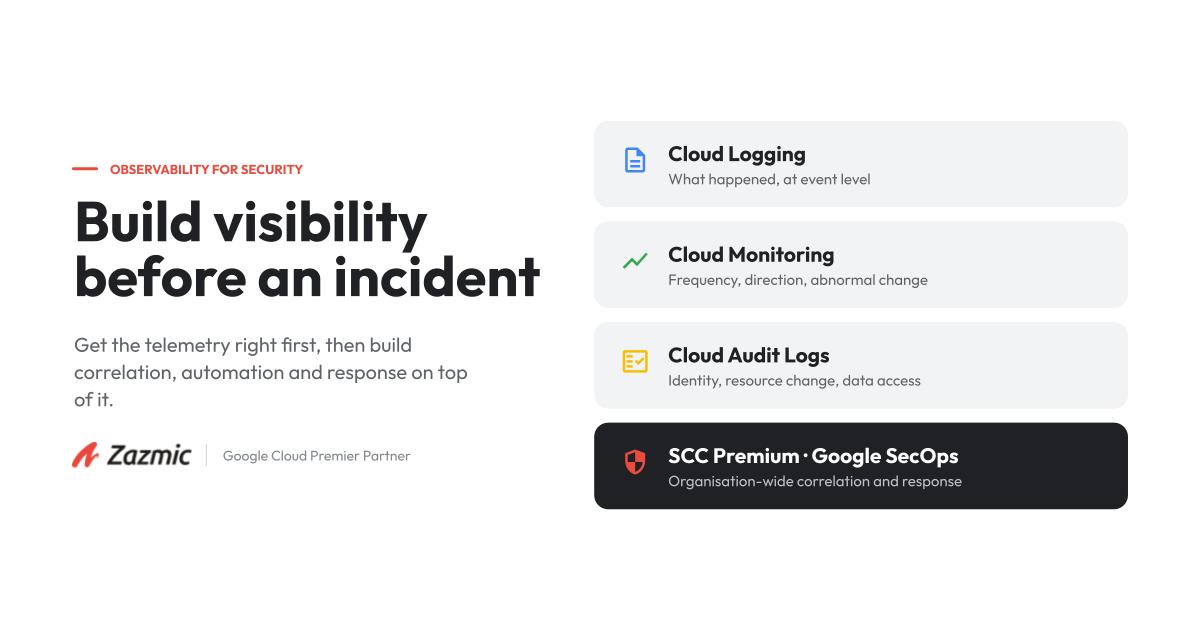
Learn how to build reliable Google Cloud security logging, monitoring, and threat detection.
There are multiple ways a cloud breach could begin, but usually it involves an exposed service, an over-permissioned identity, or an unpatched workload that goes unnoticed until an attacker uses it. Verizon found that 31% of breaches began with software vulnerabilities and 48% involved ransomware. In both cases, fast detection depends on reliable telemetry and enough context to reconstruct what happened.
In Google Cloud security, that telemetry comes from several services working together, including Cloud Logging, Cloud Monitoring, Cloud Audit Logs, and Security Command Center. This article explains how to design a reliable security data flow without collecting information blindly or creating alerts that nobody trusts.
Security Foundation: Cloud Logging and Cloud Monitoring
Google Cloud Observability combines the services formerly grouped under Stackdriver. For security teams, the two core components are Cloud Logging and Cloud Monitoring.
Cloud Logging collects platform logs, audit logs, and application logs in a central service. Logs Explorer supports precise filtering by resource, severity, identity, method, and other structured fields. Observability Analytics adds a SQL interface for aggregate analysis when log buckets are upgraded for analytics.
Cloud Monitoring tracks metrics, dashboards and alerting policies. It can notify teams when a threshold, rate of change, or specific log event matches a defined condition.
To sum up, logs explain what happened at the event level; metrics reveal frequency, direction, and abnormal changes over time. Used together, these solutions provide the foundation for threat detection in Google Cloud. When you have that in place, the next step is to identify which records provide evidence of identity use, resource changes, and access to sensitive data.
Cloud Audit Logs: Track Who Did What, Where and When
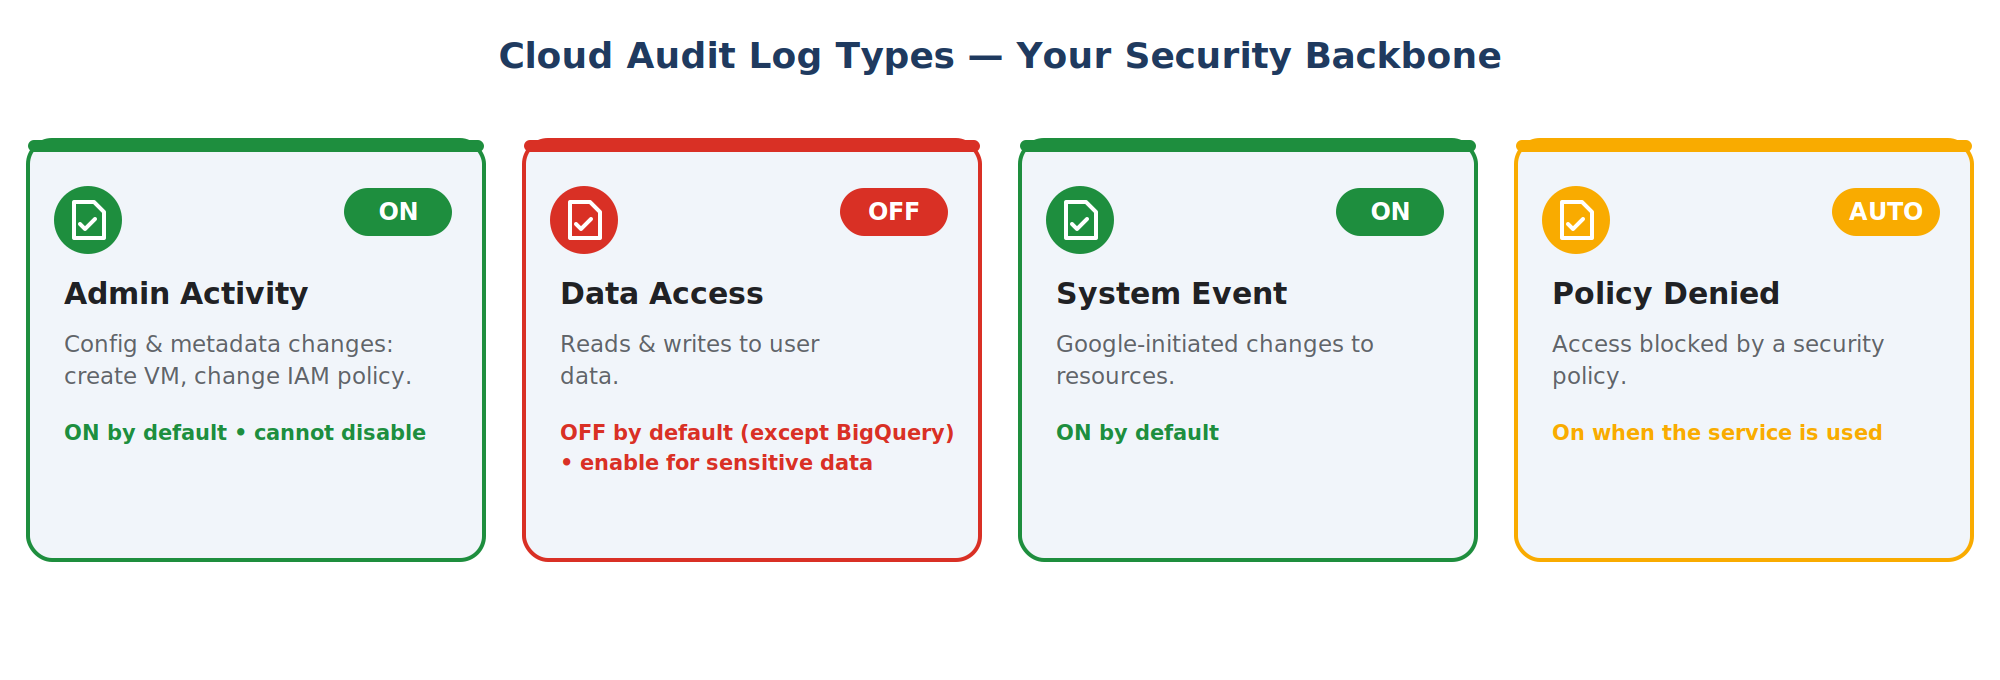
Cloud Audit Logs are the primary security record for Google Cloud control-plane and data-access activity. They are divided into four types, and each has different retention, cost, and configuration implications.
Admin Activity logs record changes to resource configuration or metadata, including VM creation and IAM policy changes. They are enabled by default and cannot be disabled.
Data Access logs record reads of configuration or user data, as well as writes to user data. They are disabled by default for most services, apart from certain BigQuery logs, because the volume can be high and may create additional logging costs. For sensitive services, leaving them disabled can remove the evidence needed to confirm whether data was viewed, copied, or changed during an incident.
System Event logs record actions taken by Google systems, including changes caused by autoscaling. They are always written and cannot be disabled or excluded.
Policy Denied logs record access denied because of a security policy violation. They are generated by default and cannot be disabled, although exclusion filters can prevent storage in Cloud Logging.
Data Access logging should therefore be configured according to risk, rather than be enabled indiscriminately or left at default. Prioritise storage services, databases, secrets, identity systems and workloads that process regulated or commercially sensitive data. Apply the policy at organisation or folder level where possible, so new projects inherit the required coverage.
Read the Structure Behind Each Event
Google Cloud audit entries use structured JSON. The LogEntry object contains common fields, while protoPayload contains the service-specific AuditLog data.
Useful investigation fields include:
timestamp
severity
resource.type and resource labels
protoPayload.authenticationInfo.principalEmail
protoPayload.serviceName
protoPayload.methodName
protoPayload.resourceName
Request metadata, including caller IP where available
Authorisation results and status codes
This structure makes cloud threat detection precise. An analyst can search for IAM policy changes by an unexpected principal, repeated access denials against a protected service, or reads from a sensitive bucket outside normal working patterns. The query should describe the behaviour under investigation rather than rely on severity alone. Many risky administrative actions are logged as successful informational events.
Build a Detection and Alerting Pipeline
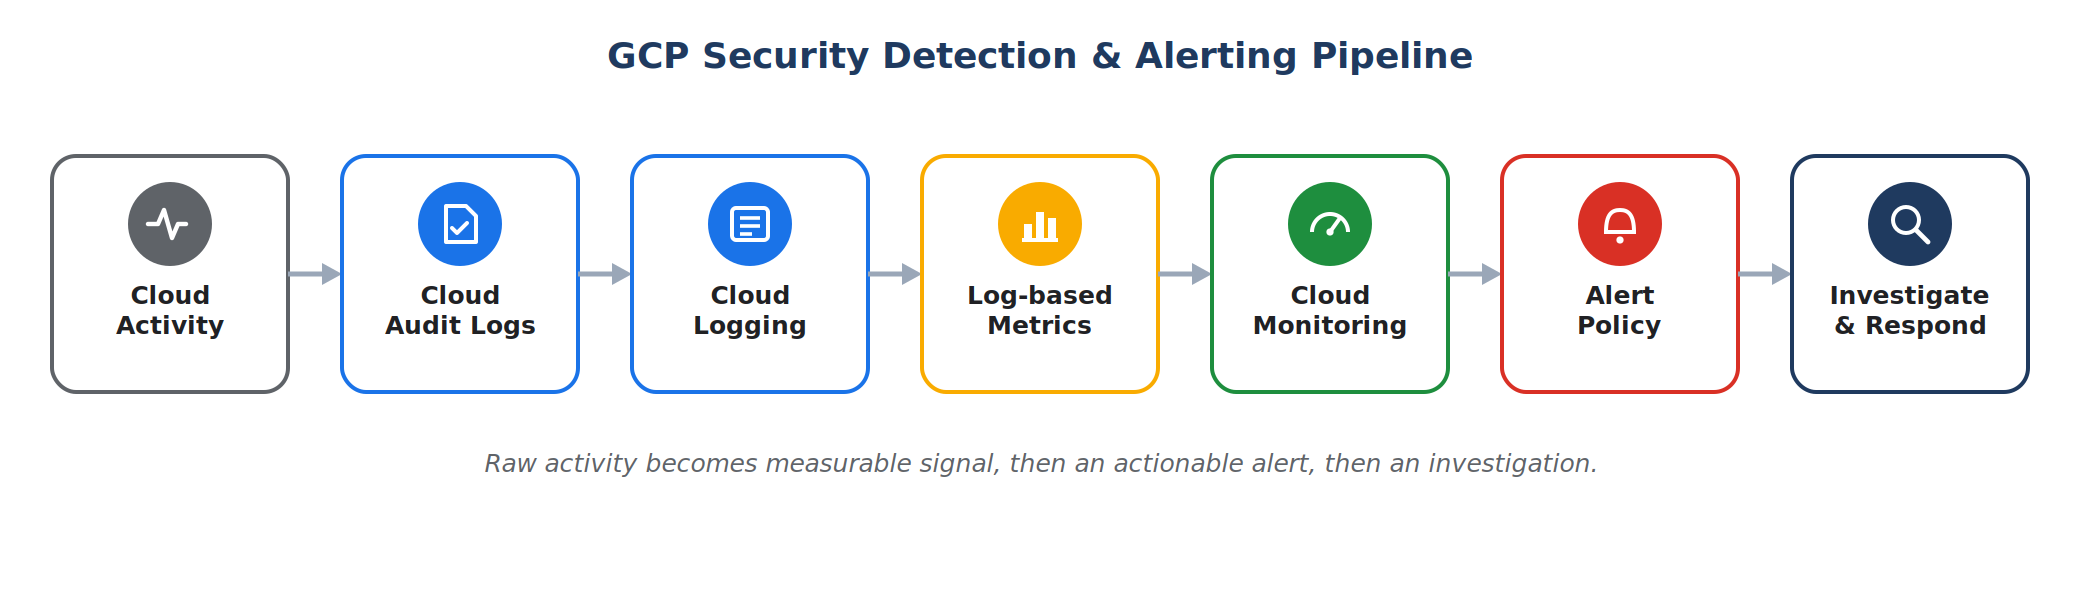
A useful security logging architecture turns telemetry into a repeatable process: capture, centralise, retain, detect, alert and respond. Each stage needs an owner and a test.
1. Define the Events That Need Coverage
Start by creating a list of attack paths you need to monitor. Common Google Cloud detections include:
IAM policy changes and new privileged role grants
Service account key creation or unusual service account use
Disabled logging, security or monitoring services
Firewall, route, load balancer and VPC changes
Public bucket or dataset exposure
Secret Manager access anomalies
Repeated Policy Denied events
Suspicious Compute Engine, GKE or Cloud Run deployments
Large or unusual data reads and exports
Map each scenario to a log source, query, alert threshold, severity, response owner, and runbook. This approach helps you avoid collecting large volumes of telemetry without knowing which events should trigger action.
2. Capture and centralize
Activity flows into Cloud Audit Logs and on into Cloud Logging. You confirm you actually have visibility by querying the logs, for instance, filtering on resource.type="audited_resource" surfaces administrative events like service enablement, configuration changes, and operations against your resources.
3. Route With Log Sinks
Cloud Logging's Log Router lets you send logs to destinations for retention or analysis — Cloud Storage for cheap long-term archival, BigQuery for SQL analytics, or Pub/Sub for streaming to another system.
A sink is just a filter plus a destination. For example, exporting only errors to a bucket:
gcloud logging sinks create my-error-sink \ storage.googleapis.com/my-bucket-name \ --log-filter="severity>=ERROR"A word of caution: Misconfigured log sinks or filters can silently exclude critical events from downstream storage. Validate routing rules after deployment and confirm that the expected records are reaching each destination.
4. Transforming Logs Into Metrics (Detection Engineering)
A log-based metric quantifies log entries matching a filter, turning qualitative data into a quantitative signal for alerting. This serves as the foundation of detection engineering, identifying significant patterns and making them measurable. For example, quantifying error events or tracking administrative actions on Compute Engine can be achieved by:
gcloud logging metrics create vm-activity-metric \ --description="Counts Compute Engine admin activity" \ --filter="severity=ERROR"5. Alert With Enough Context to Act
Cloud Monitoring allows you to create alerting policies based on your metrics. Simply define your conditions, such as thresholds or rates of change, and set up notification channels to stay informed when thresholds are crossed.
Aim for a balanced approach: overly sensitive settings lead to false positives and alert fatigue, while loose settings cause you to miss actual problems. Keep in mind that tuning these thresholds is an ongoing process rather than a one-time setup.
6. Investigate and Respond
When an alert fires, audit logs provide the timeline. Analysts can confirm the identity involved, compare the action with approved change records, inspect related activity, and decide whether to contain the account or workload.
Pub/Sub can send matching events to Cloud Run functions, workflow automation, or a SIEM. Automated actions should be narrow, reversible, and idempotent. A low-risk action might open a case and enrich it with asset data. Disabling an account or deleting a resource requires stronger controls because a false positive can disrupt production.
Security Monitoring Practices That Hold Up Under Pressure
Strong monitoring comes down to complete telemetry, clear ownership, and detections that teams can act on fast.
Centralise the logs. Route security telemetry across projects, folders and services into a dedicated security environment. Fragmented logging creates blind spots and slows investigations.
Turn on the right audit logs early. Enable Data Access logs for sensitive systems before an incident. Missing logs cannot be recovered after the fact.
Set retention by risk. Keep security logs long enough to support incident response, compliance and delayed discovery. Use Cloud Storage, BigQuery or extended log-bucket retention where needed.
Watch identities closely. Alert on IAM changes, service-account key creation, impersonation and unusual privileged access. Compromised identities are one of the most common cloud attack paths.
Automate, then tune. Replace manual reviews with alerting policies and response workflows. Refine thresholds and filters continuously to reduce noise without weakening coverage.
Enforce least privilege. Monitoring detects misuse. Least-privilege IAM limits the damage a compromised identity can cause.
Beyond Project-Level Security Monitoring: SCC Enterprise and Google SecOps
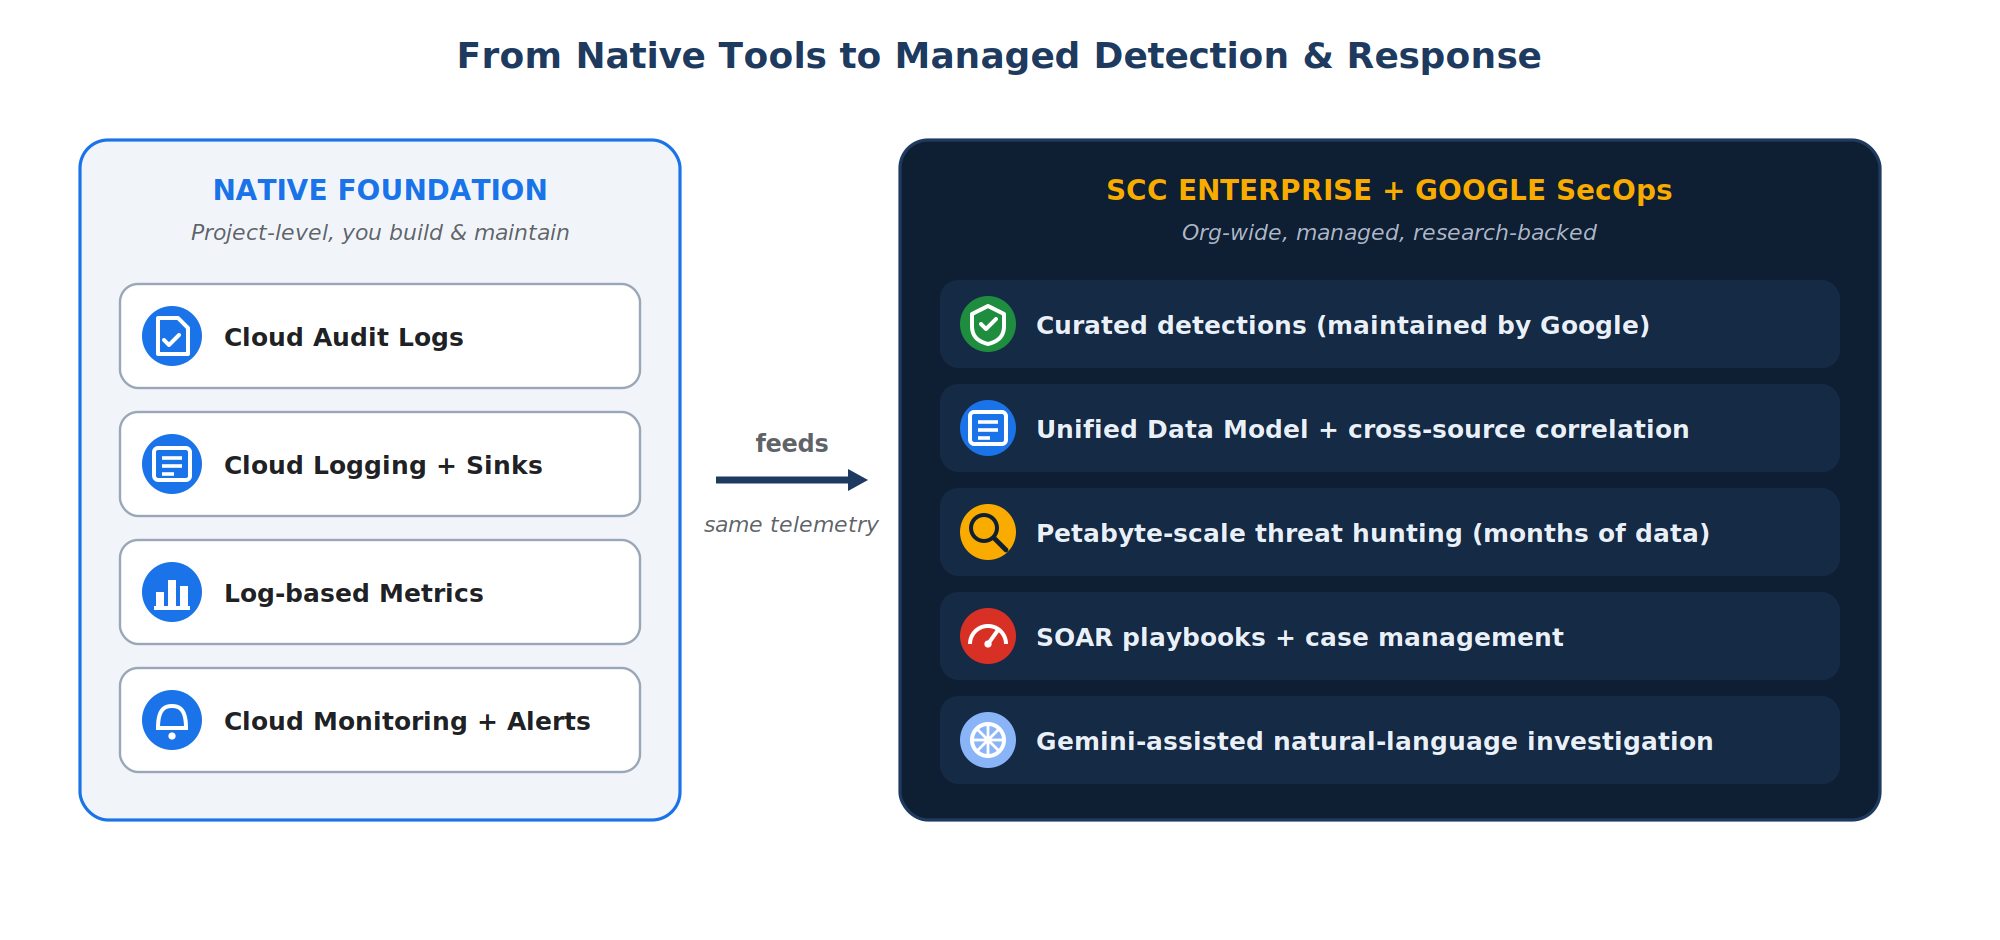
Native Logging and Monitoring can support focused detections in a project or smaller environment. Larger organisations need organisation-wide posture data, attack-path analysis, curated detections, case management, long-term search, and response automation.
Security Command Center Premium provides organisation-wide visibility into misconfigurations, vulnerabilities, attack paths, active threats and compliance findings across Google Cloud. Google SecOps adds cloud-native SIEM and SOAR capabilities for centralised detection, investigation and response. Plus, it ingests security telemetry, retains the raw records and normalises supported data into its Unified Data Model. As a result, security teams get a consistent schema for correlating activity across cloud, identity, endpoint, network and third-party sources.
Curated detection content reduces the need to create every rule from scratch. The platform supports petabyte-scale security data analysis, threat hunting, linked investigations, case management and automated response through SOAR workflows. Gemini can assist with alert triage, investigation summaries and natural-language searches across security telemetry.
Native Logging and Monitoring remain the right foundation for targeted, project-level detections. Security Command Center Premium and Google SecOps extend that telemetry into an organisation-wide security operations model.
The fundamentals still decide the quality of the result. Missing audit logs, weak routing rules and incomplete retention policies create the same blind spots in an enterprise SIEM. Get the telemetry right first, then build correlation, automation and response on top of it.
Build Visibility Before an Incident
A mature Google Cloud cybersecurity programme records the right events, stores them for the required period and turns known attack behaviours into tested detections. Start with Cloud Audit Logs, central routing and a small set of high-confidence alerts. Add retention, response automation and enterprise correlation as the environment grows.
Zazmic helps organisations assess their Google Cloud telemetry, close audit gaps, centralise security logs, configure Security Command Center and implement Google SecOps.
Book a call with our Google Cloud cybersecurity experts to build a monitoring and detection program that fits your infrastructure, risk profile and compliance obligations.